FxMath Elliott Wave Pro
A complete Elliott Wave workstation: it counts waves on live MetaTrader 5 data, draws the structure, measures it against the classic guidelines, turns it into a trade plan, and — if you enable it — sends the order. This manual covers every screen, every control and every number.
01What this is
An analysis engine plus a workstation. The counting is deterministic and auditable; the drawings, plans and orders are built on top of that one answer.
How it works
MetaTrader 5 terminal  (running, logged in)
        │  IPC — the MetaTrader5 Python package, no EA required
        ▼
  ewp/mt5feed.py    symbols · quotes · history
  ewp/pivots.py     ATR-adaptive ZigZag (5 degrees)
  ewp/rules.py      impulse / correction / triangle / combination rules
  ewp/counts.py     candidate windows, ranking, alternatives
  ewp/fib.py        projections, labels, status
  ewp/signals.py    trade plan: bias, entry, stop, targets, size
  ewp/api.py        Flask → JSON
        ▼
  static/           the dashboard (HTML + JS + chart canvas)
  ewp/trading.py    optional order execution
Nothing is uploaded anywhere. Everything runs on your machine, against your terminal.
What you get
| Area | What it does |
|---|---|
| Wave engine | Five degrees, 12 pattern codes, the three hard rules, alternatives ranking, guideline ratios. |
| Chart | Candles or line, 21 timeframes, labels, projections, channels, higher-timeframe ghost. |
| Trade plan | Bias, entry, stop at invalidation, TP1/TP2 with R:R, lot size from risk %. |
| Research | Scanner, multi-timeframe confluence, walk-forward backtest, journal. |
| Workflow | Drawings per pair, right-click menu, report export, workspaces, background alerts. |
| Execution | Buy/sell from the chart, breakeven, trailing, risk caps, panic button. |
02Install and first run
Two requirements: a running MetaTrader 5 terminal, and Python with Flask plus the MetaTrader5 package.
Requirements
| Component | Notes |
|---|---|
| MetaTrader 5 | Any broker. Must be running and logged in — the app does not start it silently. |
| Python 3.10+ | On Linux the app runs under Wine Python, because the MetaTrader5 package is Windows-only. |
| Flask | pip install -r requirements.txt |
| MetaTrader5 | pip install MetaTrader5 (Windows Python only) |
Launch
cd ~/Desktop/ElliottWavePro
./gui.sh        # native control panel (recommended)
./run.sh        # browser only, opens the dashboard
./start.sh      # background server, no browser
./stop.sh       # stop the background server
On Windows, the equivalent entry points are gui.bat-style shortcuts or, once packaged,
FxMathElliottWavePro.exe — see BUILD_WINDOWS.md.
Check the feed before anything else
wine python -m ewp --checkIt prints the package status, the account, and every terminal it found:
MetaTrader5 package : yes
terminal connected  : True (connected)
account             : {'login': 115412174, 'server': 'MetaQuotes-Demo', ...}
terminals found     :
   * MetaTrader 5                 running  C:\Program Files\MetaTrader 5\terminal64.exe
AMarkets - MetaTrader 5 closed C:\Program Files\AMarkets - MetaTrader 5\terminal64.exeMetaTrader5 package is not importable in the Python that launched the app. Use
wine python -m ewp (or the Windows exe). The app still runs, but only on the sample
CSV files in data/.
03The control panel
A native window that finds your terminals, remembers your settings and hands them to the dashboard.
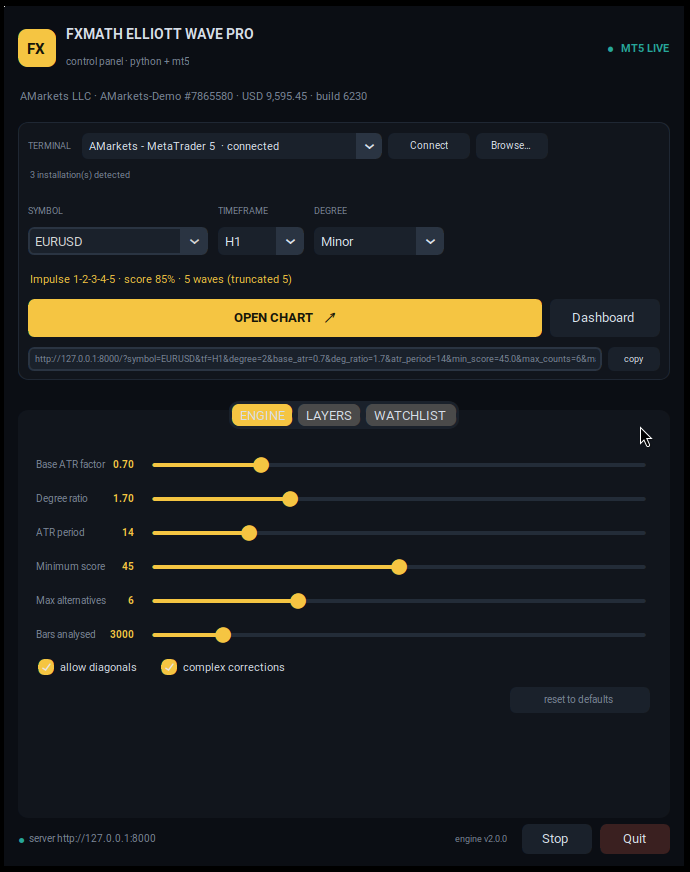
TERMINAL row
Every terminal64.exe found on the machine is listed with a connected or
running marker. Three buttons:
| Connect | Attaches the app to that terminal and reloads its symbol list. The choice is saved. |
| Browse… | Pick a folder by hand — it scans for terminal64.exe inside it and one level below, then connects. |
| dropdown | Shows which installation is currently attached. |
Pair, timeframe, degree
The SYMBOL box searches the whole broker catalogue as you type. TIMEFRAME
lists all 21 timeframes. DEGREE picks the Elliott degree. Under them, a live preview
of the current count:
Impulse 1-2-3-4-5 · score 93% · 5 waves completeEngine tab
Base ATR factor, degree ratio, ATR period, minimum score, max alternatives, bars analysed, and the diagonal/complex-correction switches. These are the same parameters the dashboard exposes in Settings; changing them here changes the chart you open.
Layers tab
Chooses what the dashboard draws: structure, labels, Fibonacci, targets, channel, history, sub-waves, all degrees, plus the light/dark theme.
OPEN CHART vs Dashboard
- OPEN CHART opens the browser with your settings encoded in the URL.
- Dashboard opens the plain dashboard, using whatever the browser remembered.
- The link below the buttons is the exact URL of the current configuration — copy it to bookmark or share.
?symbol=XAUUSD&tf=M15°ree=1&base_atr=0.7&layers=structure,labels),
so a link always reproduces the exact view.
04Dashboard tour
One screen: the chart on the left, the analysis and your tools on the right.
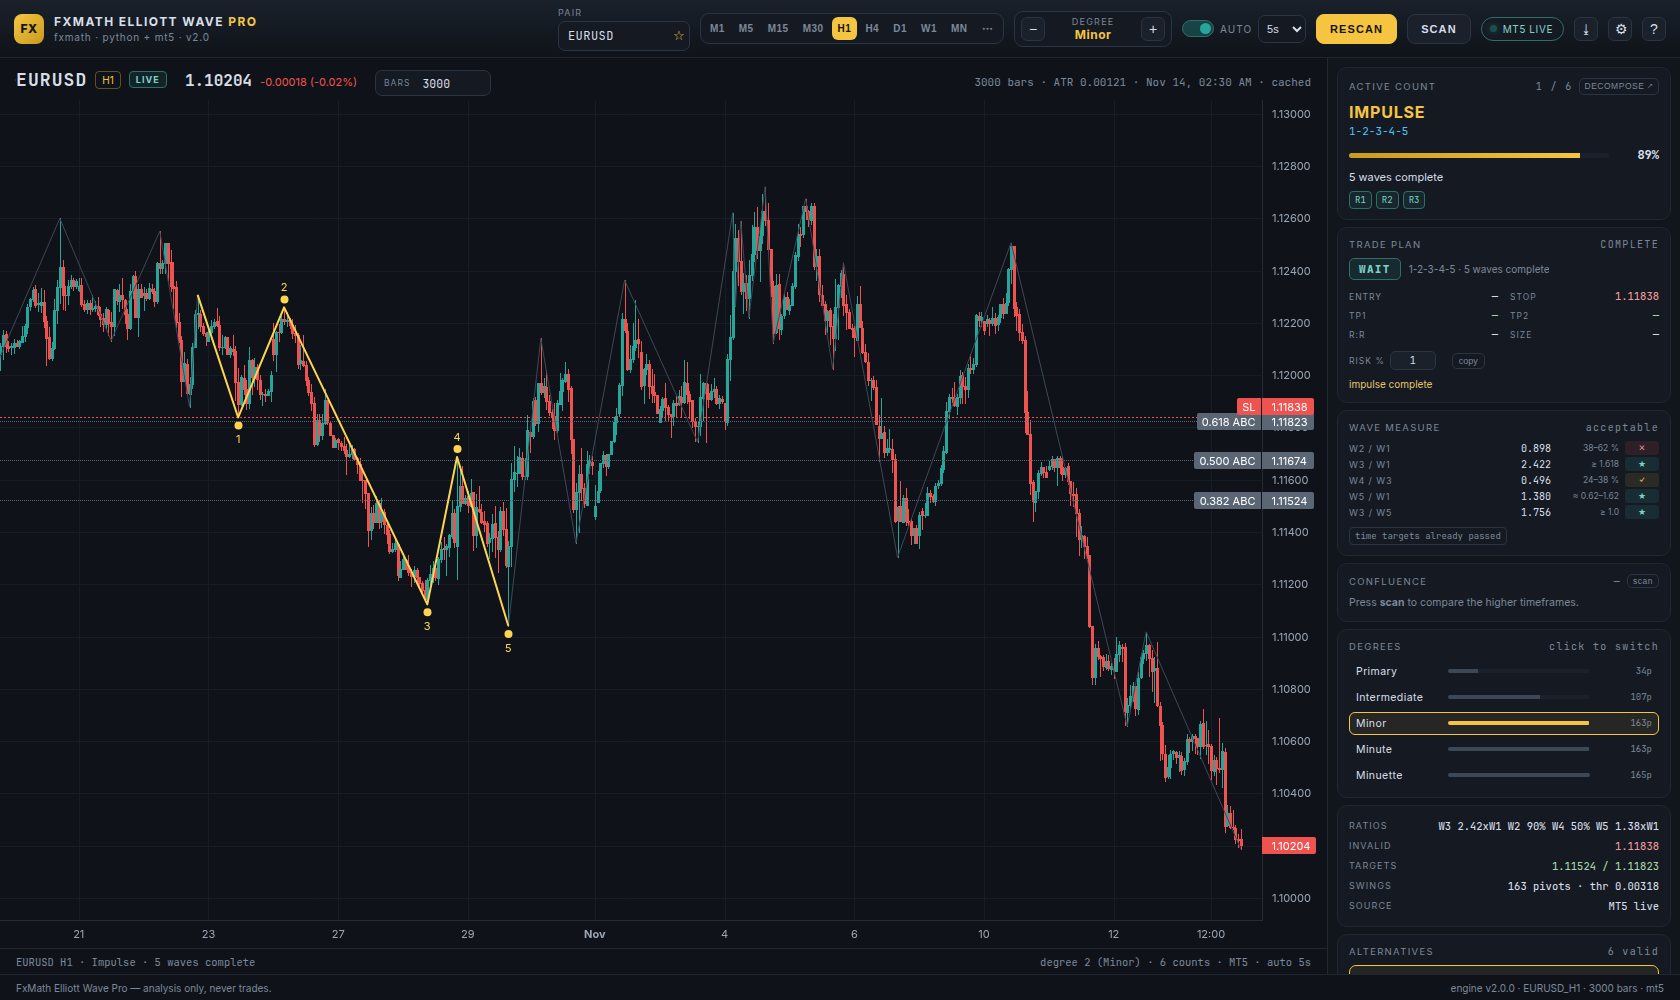
Top bar
| Control | Behaviour |
|---|---|
PAIR | Search the whole broker catalogue. ☆ pins the pair to the watchlist. |
| Timeframe tabs | M1, M5, M15, M30, H1, H4, D1, W1, MN. The ⋯ button opens the other 12 (M2…H12). |
| Degree stepper | − coarser, + finer. Equivalent to keys 1–5. |
AUTO + interval | Refreshes the chart every 3–60 s. Off = manual only. |
RESCAN | Drops the caches and re-reads the terminal. |
SCAN | Opens the multi-pair scanner. |
| Connection pill | MT5 LIVE / MT5 OFFLINE / CSV DATA, with the account on hover. |
| ⤓ · ⚙ · ? | Report export, settings, help. |
Chart header
Pair, timeframe badge, live tag, price and change, then the BARS field: how many
bars are pulled from the terminal and analysed (200–20 000). The right side shows
N bars · ATR · last bar time.
Right panel, top to bottom
| Card | Content |
|---|---|
| POSITIONS | Only when trades are open — side, volume, entry, live P/L, close buttons. |
| OBJECTS | Only when drawings exist — every line on this chart with a delete button. |
| ACTIVE COUNT | Pattern name, wave sequence, confidence bar, R1/R2/R3 chips and the DECOMPOSE button. |
| TRADE PLAN | Bias badge, phase, entry/stop/TP1/TP2/R:R, size, the lot box and BUY/SELL. |
| WAVE MEASURE | Guideline ratio table with ideal/acceptable/off marks, plus Fibonacci time targets. |
| CONFLUENCE | scan compares H1/H4/D1/W1 and reports agreement. |
| DEGREES | Pivot count and threshold per degree; click a row to switch. |
| RATIOS | Wave ratios, invalidation, targets, swing count, data source. |
| ALTERNATIVES | Up to 18 ranked competing counts — click one to make it active. |
| LAYERS | Every overlay switch, plus the HTF ghost. |
| WATCHLIST | Pinned pairs; click to load. |
| ALERTS | Event log from the browser and from the background monitor. |
Bottom status bar
Left: a one-line summary of the structure. Right: degree, number of valid counts, data source and auto-refresh interval. The footer repeats the engine version and the disclaimer.
Light theme
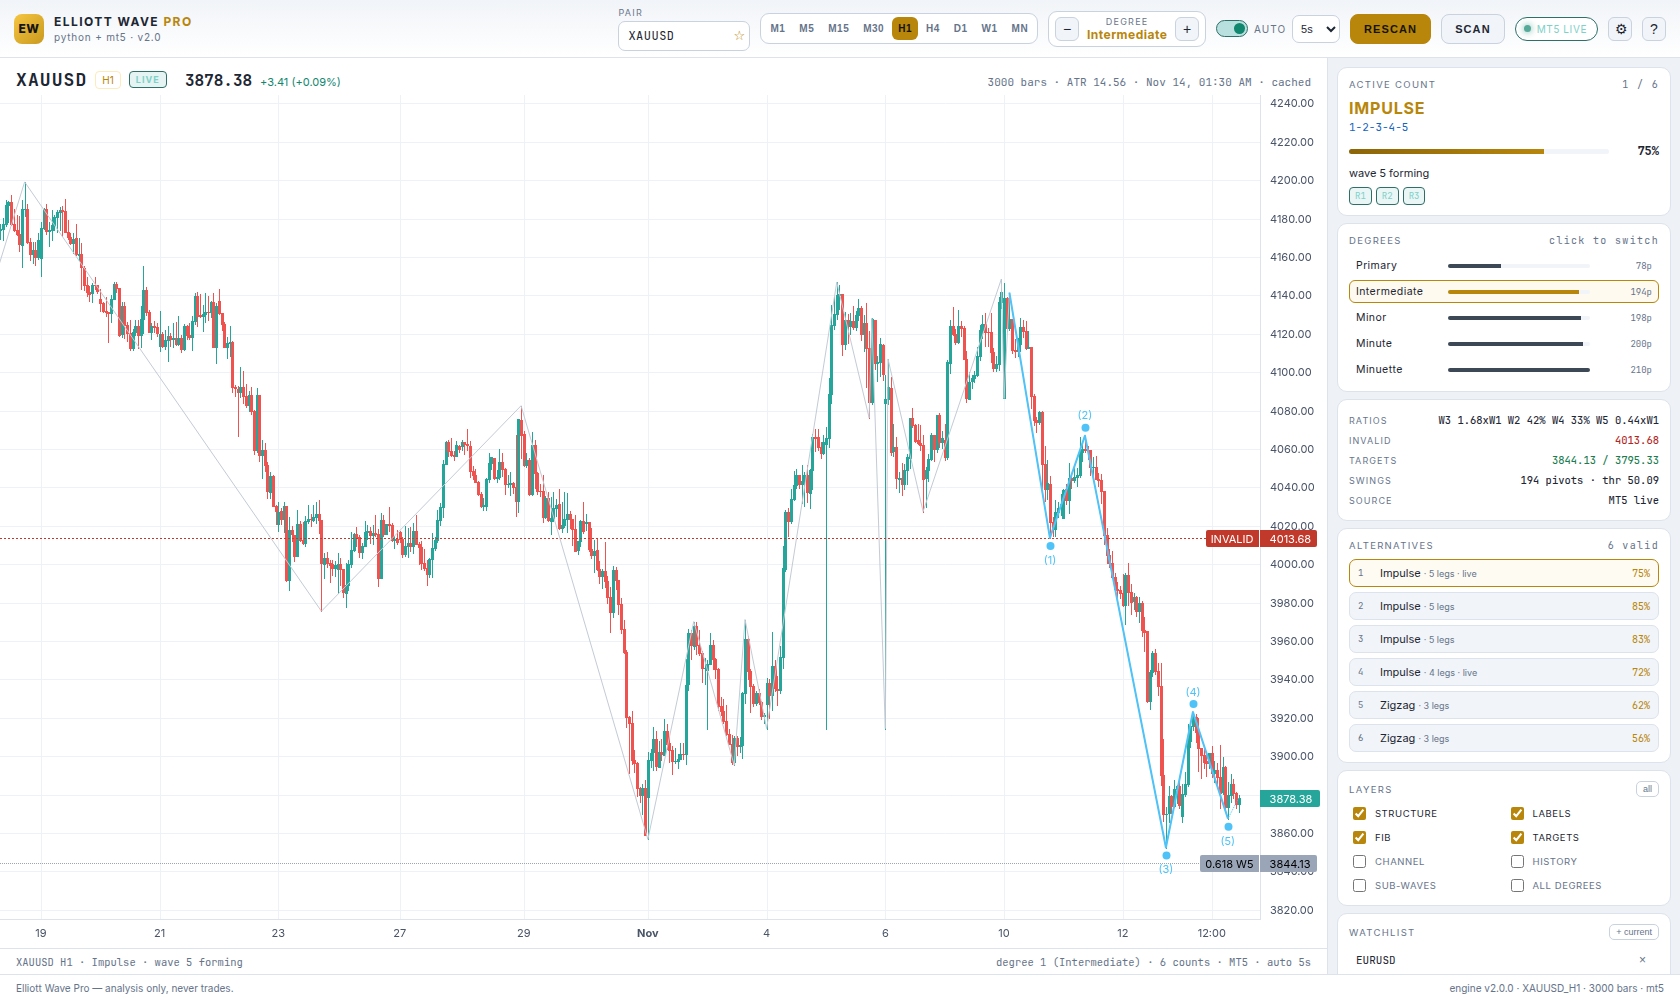
05Timeframes and degrees
Two independent axes: the chart's timeframe, and the wave degree you are counting.
Timeframes
All 21 the terminal can build are supported:
M1 M2 M3 M4 M5 M6 M10 M12 M15 M20 M30 H1 H2 H3 H4 H6 H8 H12 D1 W1 MN.
Nine are tabs; the rest live behind ⋯. Every timeframe is available for every symbol —
nothing has to be exported first.
Degrees
| Level | Name | Labels | Typical use |
|---|---|---|---|
| 0 | Primary | [1] [2] [3]… | multi-month structure |
| 1 | Intermediate | (1) (2) (3)… | weeks |
| 2 | Minor | 1 2 3 4 5 | days — default |
| 3 | Minute | i ii iii… | intraday |
| 4 | Minuette | (i) (ii)… | fine intraday |
Each degree has its own swing threshold: ATR × base × ratio^(4 − degree). A coarser
degree ignores small noise; a finer one reacts to it. The DEGREES card shows how many pivots each
level produced, which tells you whether a degree is too fine (hundreds of pivots) or too coarse
(under ten).
Decomposing a wave
Press DECOMPOSE ↗ (or X): the app pushes the current degree, jumps one degree finer and zooms the chart to that structure's own time window. A breadcrumb appears so you can walk back.
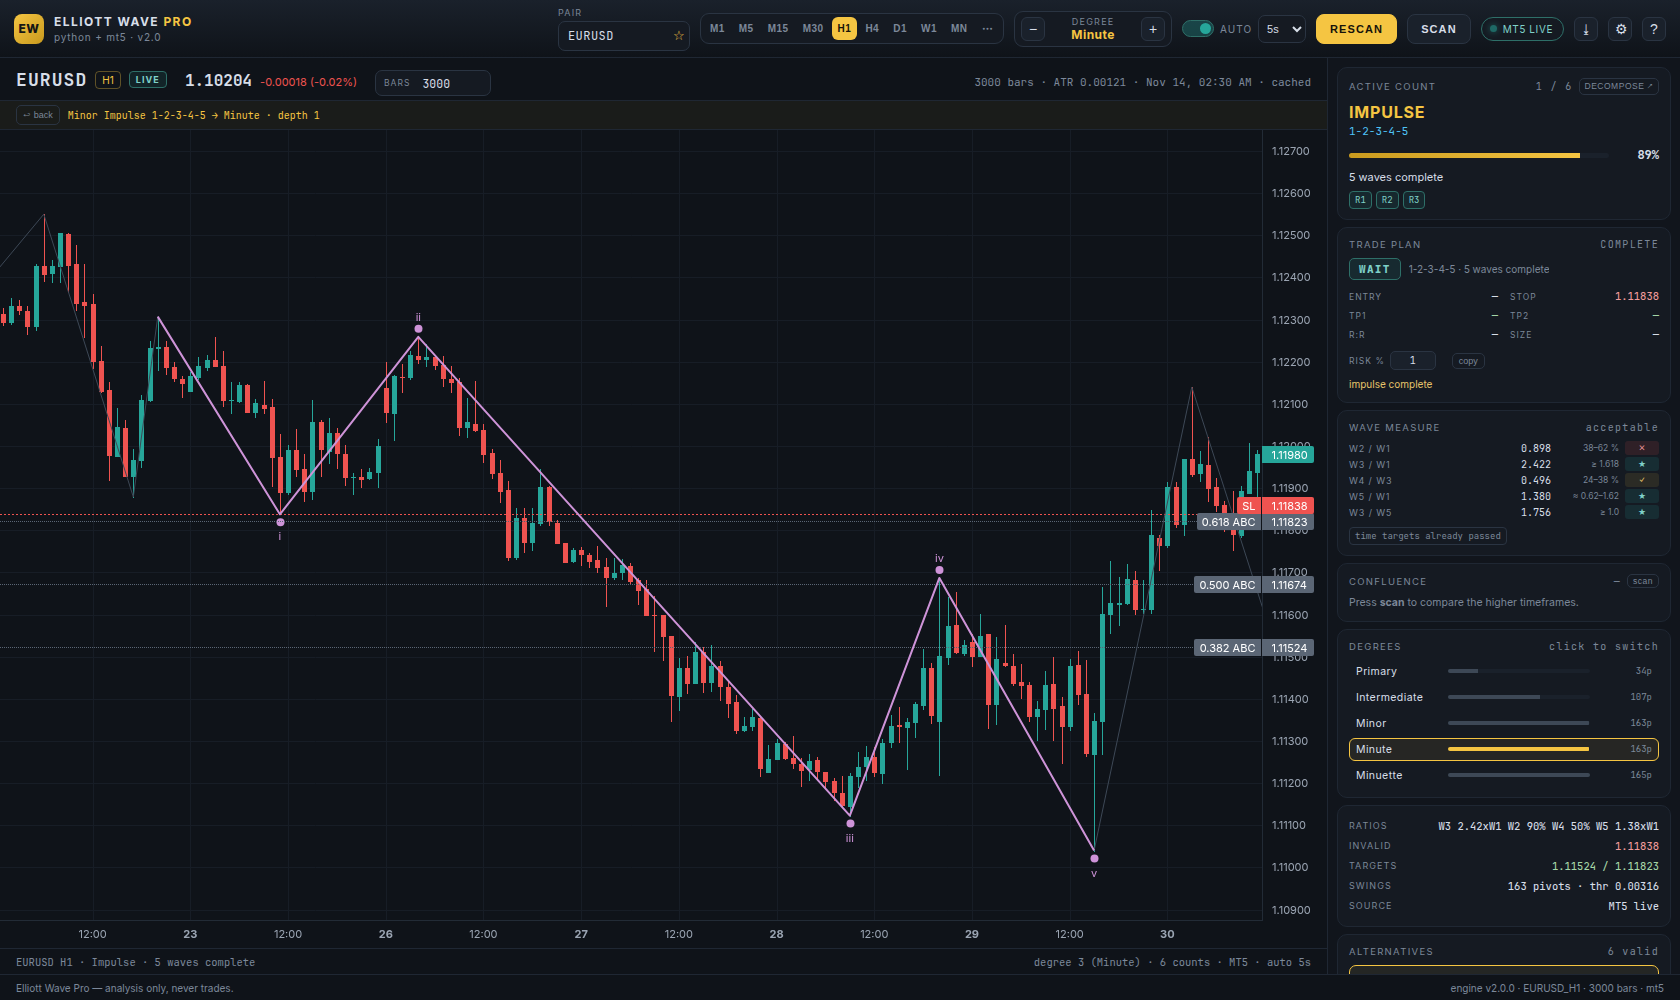
1-2-3-4-5 decomposed into Minute i-ii-iii-iv-v, zoomed to the structure with 12 % padding.Two related overlays do something different:
- SUB-WAVES — draws the best finer impulse inside the active count, in place, without navigating.
- ALL DEGREES — every degree's ZigZag at once, faint, so you can see how they nest.
06Reading the count
What the pattern name, the score, the ratios and the percentages actually mean.
The three hard rules
| Chip | Rule | If violated |
|---|---|---|
| R1 | Wave 2 never retraces more than 100 % of wave 1 | count rejected |
| R2 | Wave 3 is never the shortest of waves 1, 3, 5 | count rejected |
| R3 | Wave 4 never enters wave 1's price territory (diagonals excepted) | count rejected, or promoted to diagonal |
The chips on the card are coloured: green = satisfied, yellow = not applicable (diagonal / incomplete), red = broken.
Score
A 0–100 confidence built from: base pattern quality, the Fibonacci ratios (W2 38–62 %, W3 ≥ 1.618×W1, W4 24–38 %, W5 ≈ W1), alternation, and whether the structure is still unfolding. It is a ranking device between competing counts — not a probability of profit.
Alternatives
Elliott Wave is ambiguous by nature. The engine keeps up to 18 rule-compliant interpretations and ranks them; clicking one makes it active, and labels, projections and the trade plan follow. Two counts can both be “valid” — the score is how they are ordered.
Wave measure
Independent of the score, this table checks the guideline ratios:
| Mark | Meaning |
|---|---|
| ★ ideal | inside the textbook band |
| ✓ acceptable | outside the ideal band but common |
| ✗ off | the structure does not look like this pattern |
For corrections the rows are B/A and C/A; for triangles
C/A, D/B, E/C; for diametrics F/A,
E/B, D/C. The verdict line reads textbook, acceptable
or distorted.
Fibonacci time targets
Under the table, the projected turns: 0.618, 1.0 and 1.618 times the duration of the leg that just finished. Past dates are filtered out — if everything is behind you, the card says “time targets already passed”.
Status lines
wave 3 forming | leg three is live — the classic entry zone. |
5 waves complete | the impulse is finished; expect a correction. |
5 waves (truncated 5) | wave 5 failed to exceed wave 3 — a failure, and a warning. |
A-B-C complete | correction finished. |
no valid Elliott structure | nothing passed the rules at this degree — switch degree or wait. |
07Patterns
Twelve codes, each with its own validity test.
| Family | Code | Validity (summary) |
|---|---|---|
| Impulse | IMPULSE | 5 legs, R1–R3 hold, wave 3 clears wave 1's end. |
DIAGONAL | Overlapping wave 4 with contracting legs — the only place R3 is waived. | |
| Correction | ZIGZAG | B retraces ≤ 90 % of A, C extends beyond A. |
FLAT | B ≈ A (0.9–1.08), C returns to the start. | |
RUNNING_FLAT | As flat, but C stops short — trend strength. | |
EXPANDED_FLAT | B exceeds A, C exceeds B. | |
| Triangle | TRIANGLE | five legs contracting toward the apex. |
EXPANDING_TRIANGLE | legs grow outward. | |
RUNNING_TRIANGLE | contracting, but B pushes past the origin of A. | |
| Combination | WXY | double zigzag: X retraces 25–80 % of W, Y takes out W's extreme. |
WXYXZ | triple three: two connectors, three same-direction legs, net travel < 60 % of the distance walked. | |
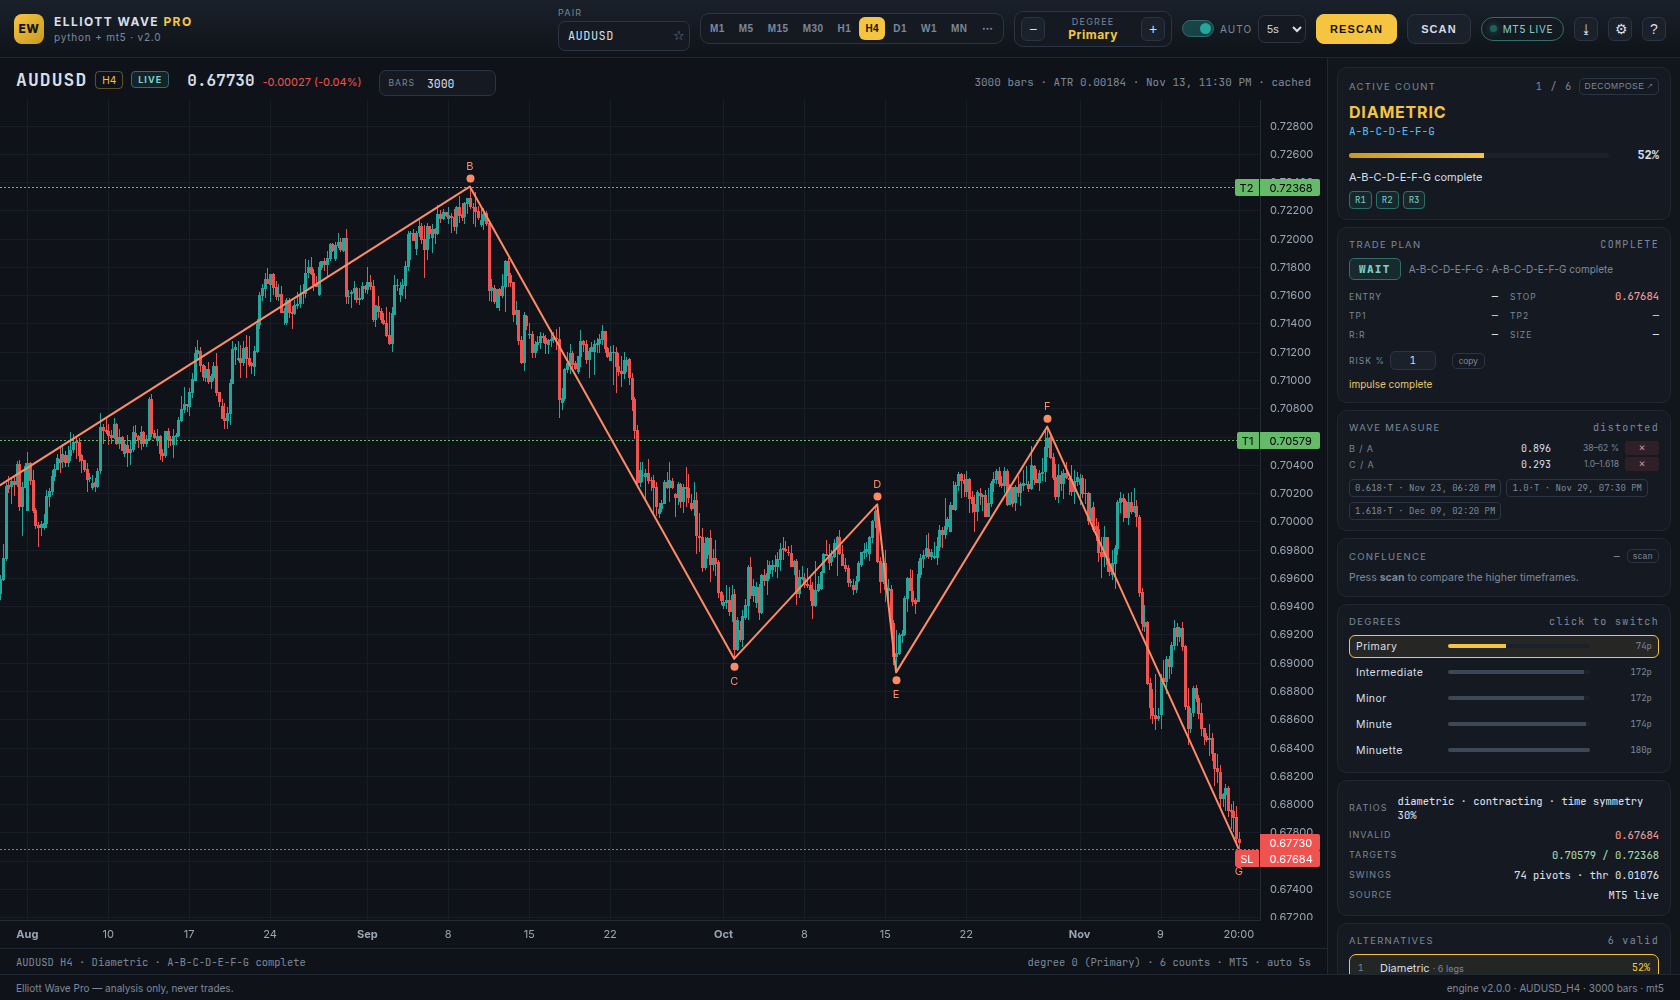
| NeoWave | DIAMETRIC | seven legs, price contracts into D then expands (or the reverse), time symmetry scored. |
08The trade plan
If the count is right, this is where you would act — and where you would be wrong.
| Field | Meaning |
|---|---|
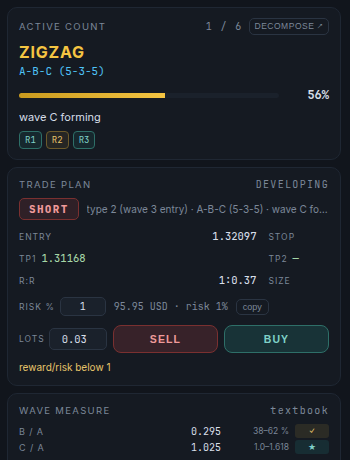
| Badge | LONG / SHORT / WAIT. WAIT means the impulse is complete — the honest answer is “wait for the correction”, not “join the trend late”. |
| Setup tag | Advanced GET vocabulary: type 2 (wave 3 entry, best), type 3 (late, wave 5), type 1 (wave 5 failure). |
| ENTRY | Market price, or the 38.2–61.8 % pullback zone of the last leg when one exists on the correct side. |
| STOP | The invalidation level of the count — the price that says “this wave count is wrong”. |
| TP1 / TP2 | Fibonacci thrusts, TP1 is the headline target. |
| R:R | TP1 distance ÷ stop distance. Below 1 the card says so instead of hiding it. |
| SIZE | Lots from risk % × equity ÷ (stop distance × point value), rounded to the broker's volume step and clamped by max lots. |
Reading the caution line
- reward/risk below 1 — the target is closer than the stop; a valid count with a poor trade.
- late entry — wave 5 of a mature impulse — the trend is nearly spent.
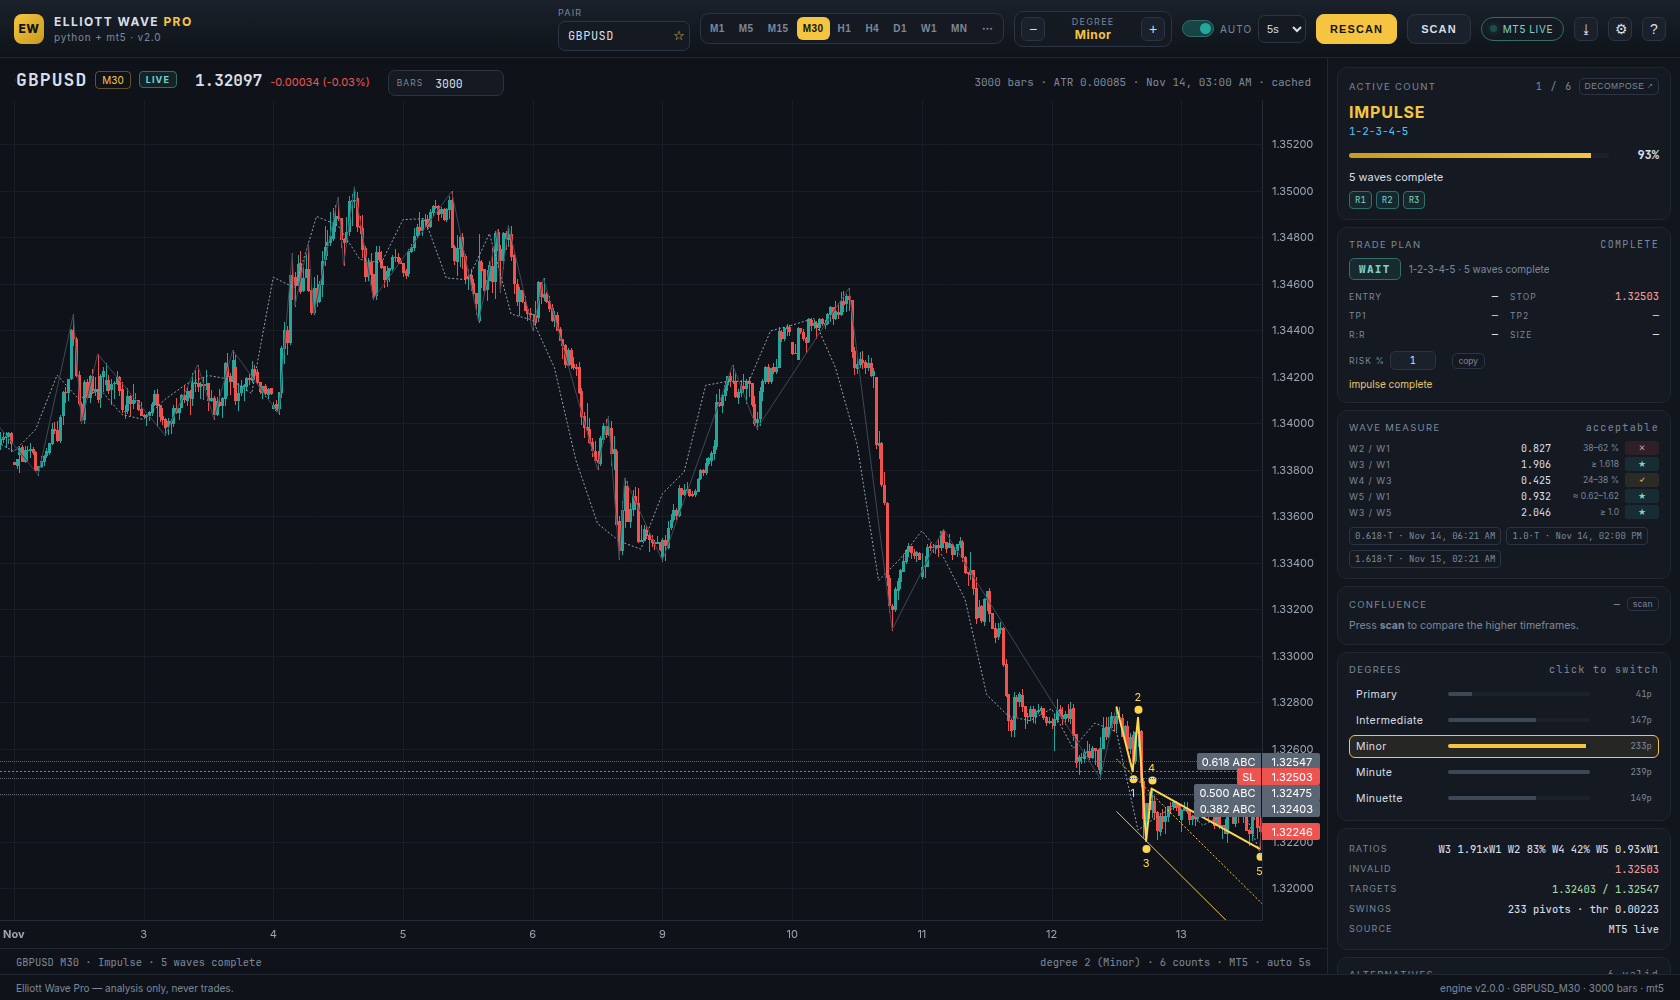
- impulse complete — nothing to do here; decompose into the correction instead.
On the chart
The plan draws three lines: ENTRY (blue), SL (red) and the targets
(green). They always come from the same numbers as the card, so the picture and the text cannot
disagree.
?equity= if you
pass one), so the same plan sizes differently on a demo and a live account — as it should.
09Drawings and objects
Trendlines, channels, Fibonacci retracements and text labels, saved per pair and timeframe.
Drawing
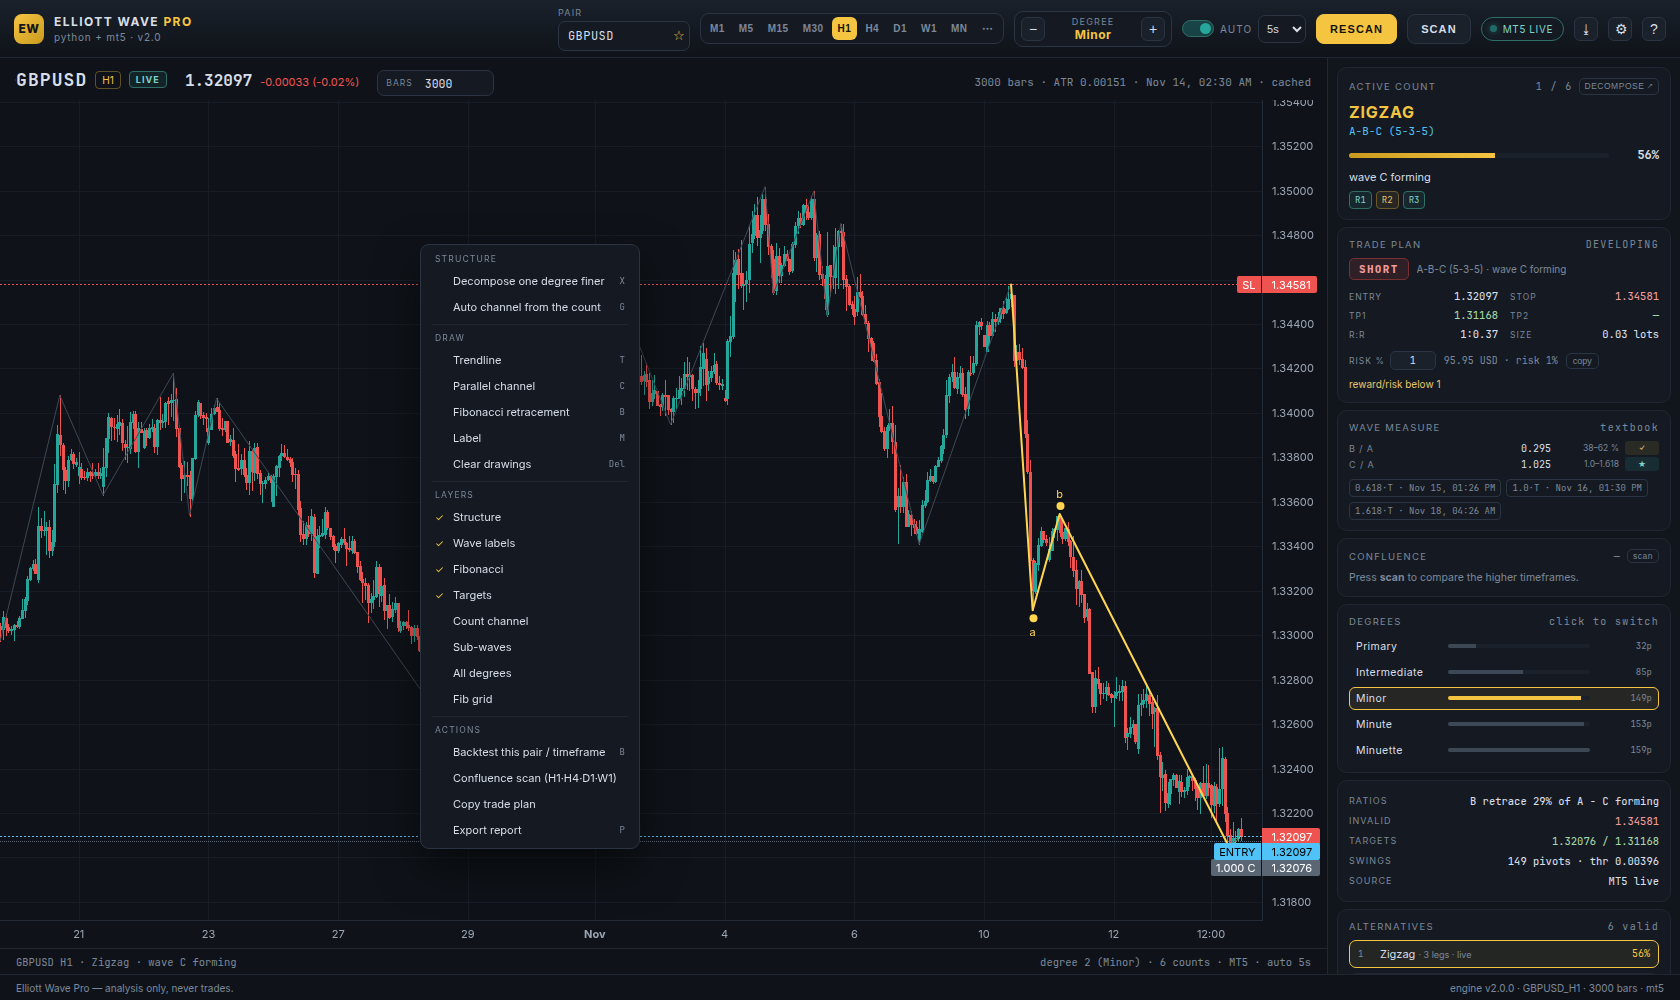
| Tool | Key | How |
|---|---|---|
| Trendline | T | click A, click B; the line extends to the latest bar. |
| Parallel channel | C | click A, click B; the second rail snaps to the extreme price between the clicks, plus a dashed midline. |
| Fibonacci retracement | B | click the start, click the end; 0 / 23.6 / 38.2 / 50 / 61.8 / 78.6 / 100 %. |
| Label | M | click a point, type the text. |
| Auto channel | G | builds a channel around the active count in one action. |
Selecting and deleting
Three ways, all equivalent:
- Click the line — it turns red — then Del.
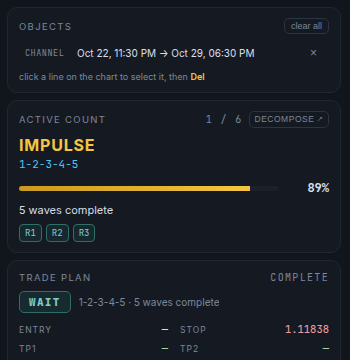
- OBJECTS card at the top of the panel lists every drawing on this pair/timeframe;
×deletes one, clear all wipes them. - Right-click → Delete selected object (Del) or Clear all drawings (⇧Del).
Higher-timeframe ghost
The HTF GHOST layer overlays the next-higher timeframe's close as a dashed line — M30 shows H4, H1 shows H4, H4 shows D1 — for degree context without leaving the chart.
10Research tools
Scanner, confluence, backtest, journal, report and workspaces.
Scanner
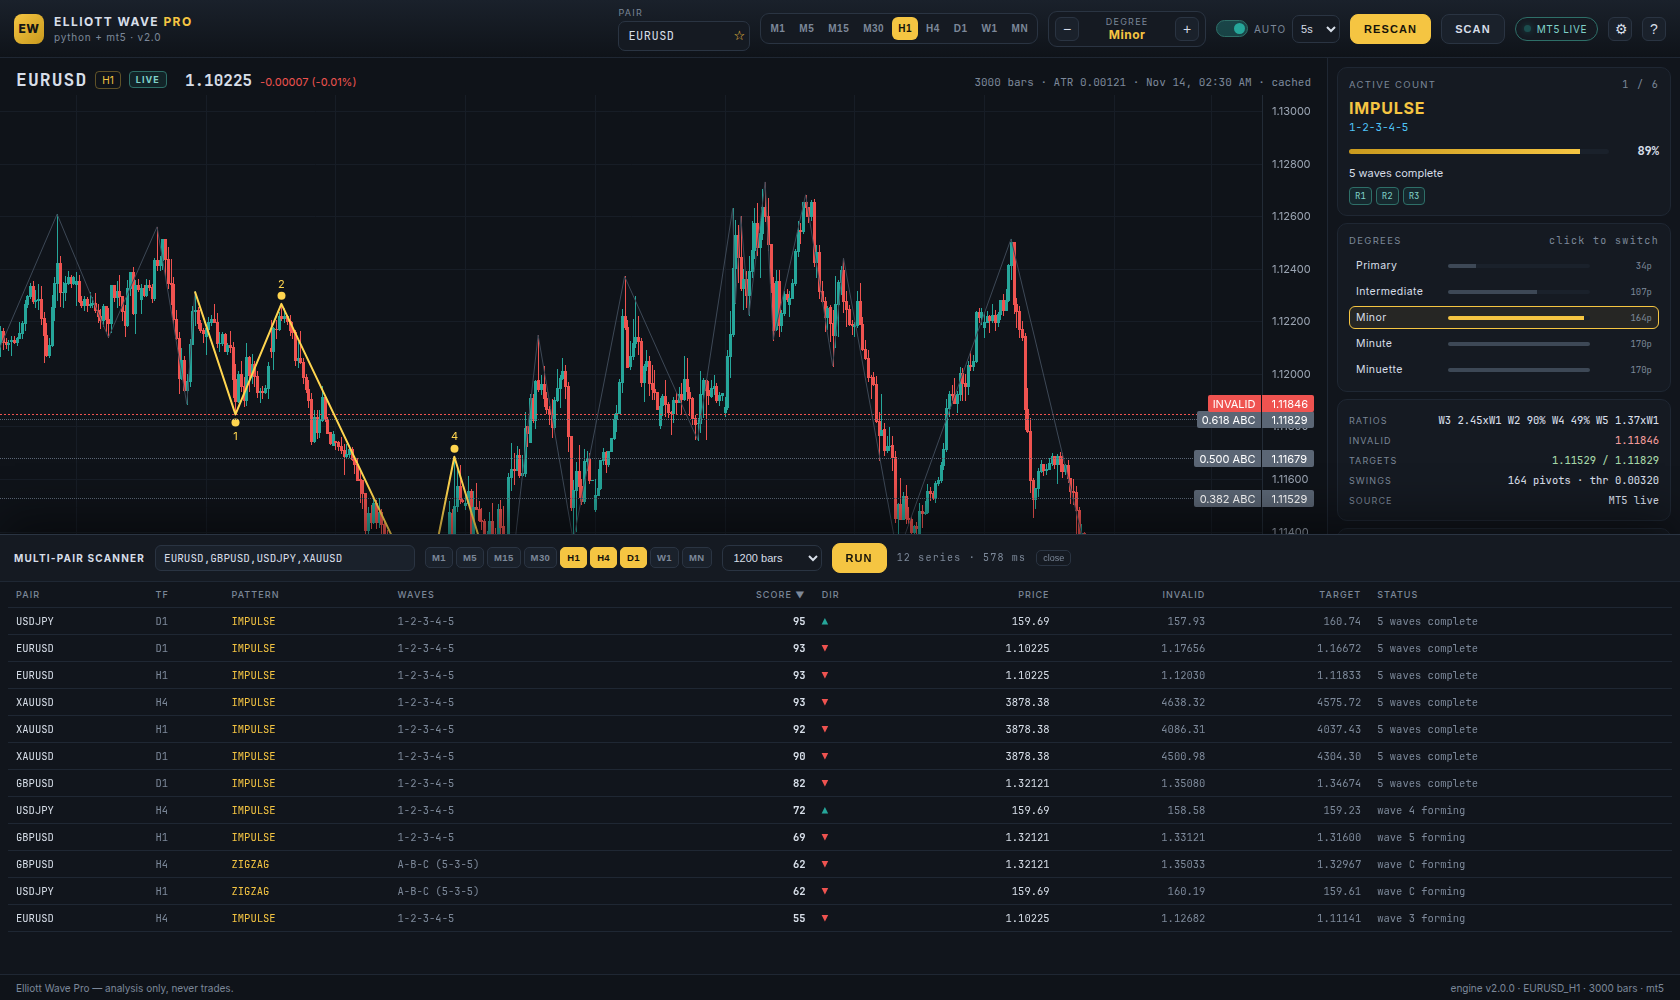
Comma-separate the pairs, pick the timeframe chips, set BARS (any value 200–20 000; it drives both the history fetch and the analysis window), then RUN. Every column sorts; a click opens that pair and timeframe. The progress line shows elapsed time — the first scan of a new symbol/depth is slower because the terminal has to build that history once.
Confluence
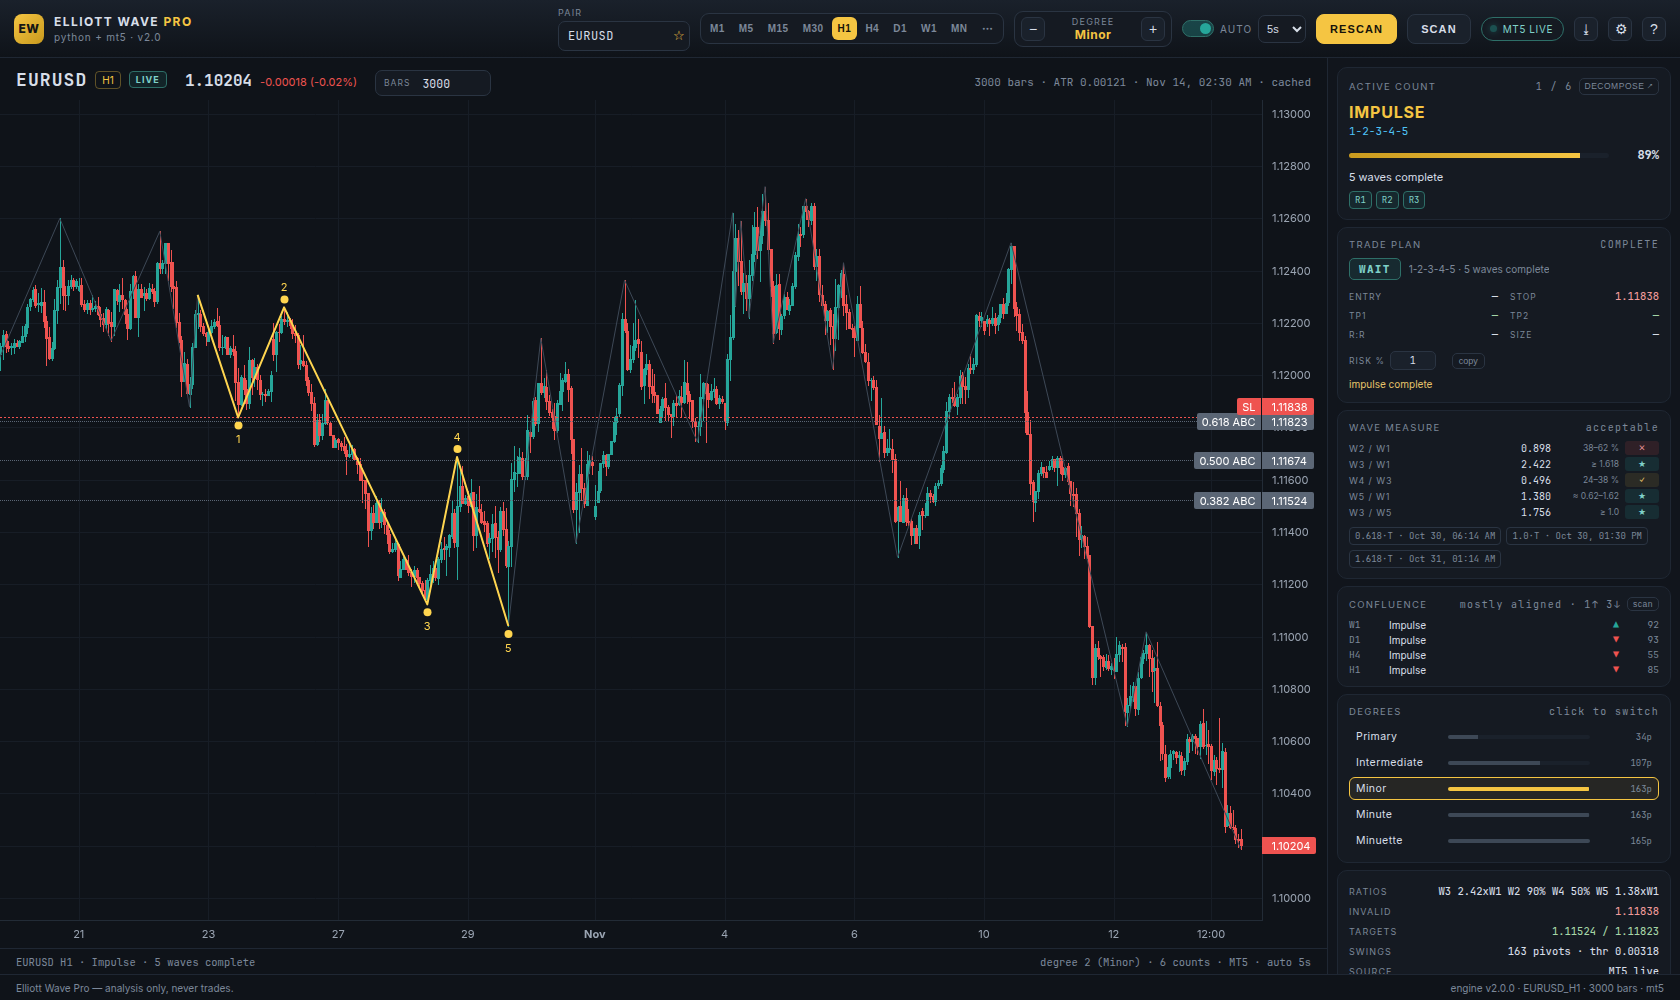
scan runs the engine on four timeframes and reports how many agree: aligned, mostly aligned, mixed, conflicting. Click a row to jump to that timeframe. Counter-trend waves stand out immediately — e.g. “1↑ 3↓” on a bounce.
Backtest
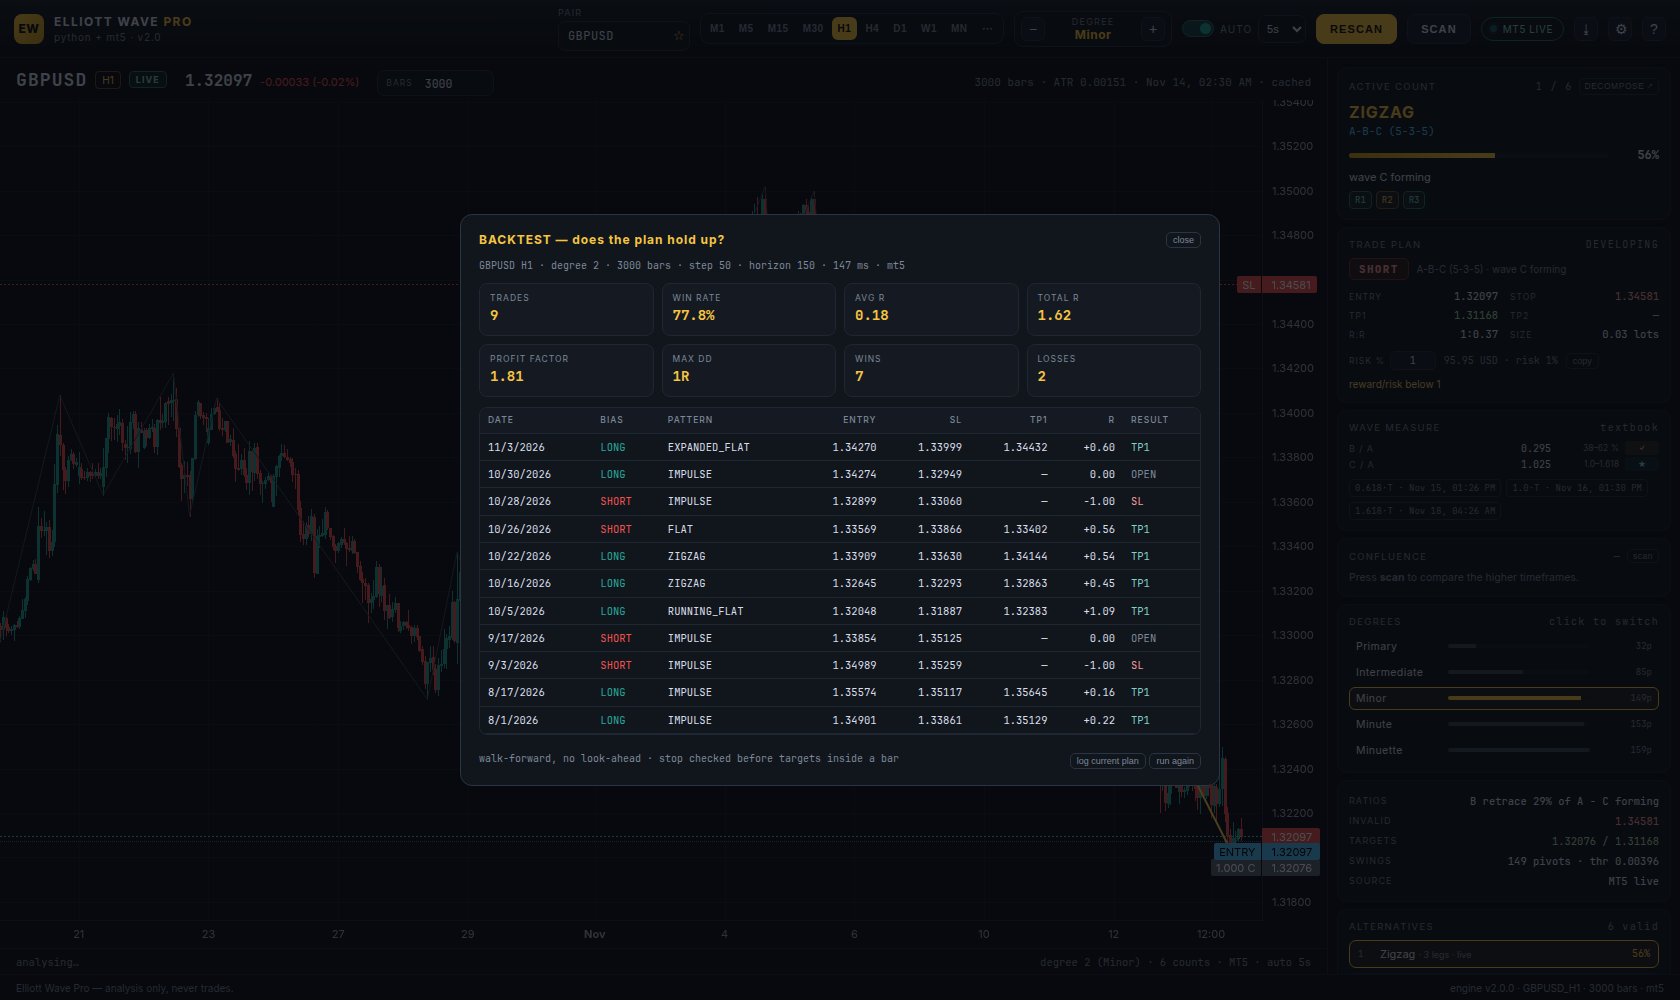
At each step only the bars up to that point are visible, so the count is the one you would really have seen; the outcome is then read from the following bars, and the stop is checked before the target inside each bar (the conservative assumption). Reports trades, win rate, average R, total R, profit factor and max drawdown.
Journal
log current plan stores the live plan with its price; the journal scores every logged plan later against what price actually did.
Report and sharing
P or the ⤓ button builds a sheet with the chart image, the plan, the measure table and the confluence verdict, and opens it in its own window. A share bar sits at the top:
| Button | What it does |
|---|---|
| X · Telegram · WhatsApp · Email | opens the network with the summary text pre-filled |
| Facebook · LinkedIn · Reddit | same, but they need a public URL — greyed out while the app runs on 127.0.0.1 |
| Copy image | puts the chart PNG on the clipboard, ready to paste into a post |
| Share… | system share sheet with the image attached (mobile, and desktop where supported) |
| Download PNG | saves the chart as SYMBOL-TF-timestamp.png |
| Print / PDF | print dialog — “Save as PDF” for a shareable file |
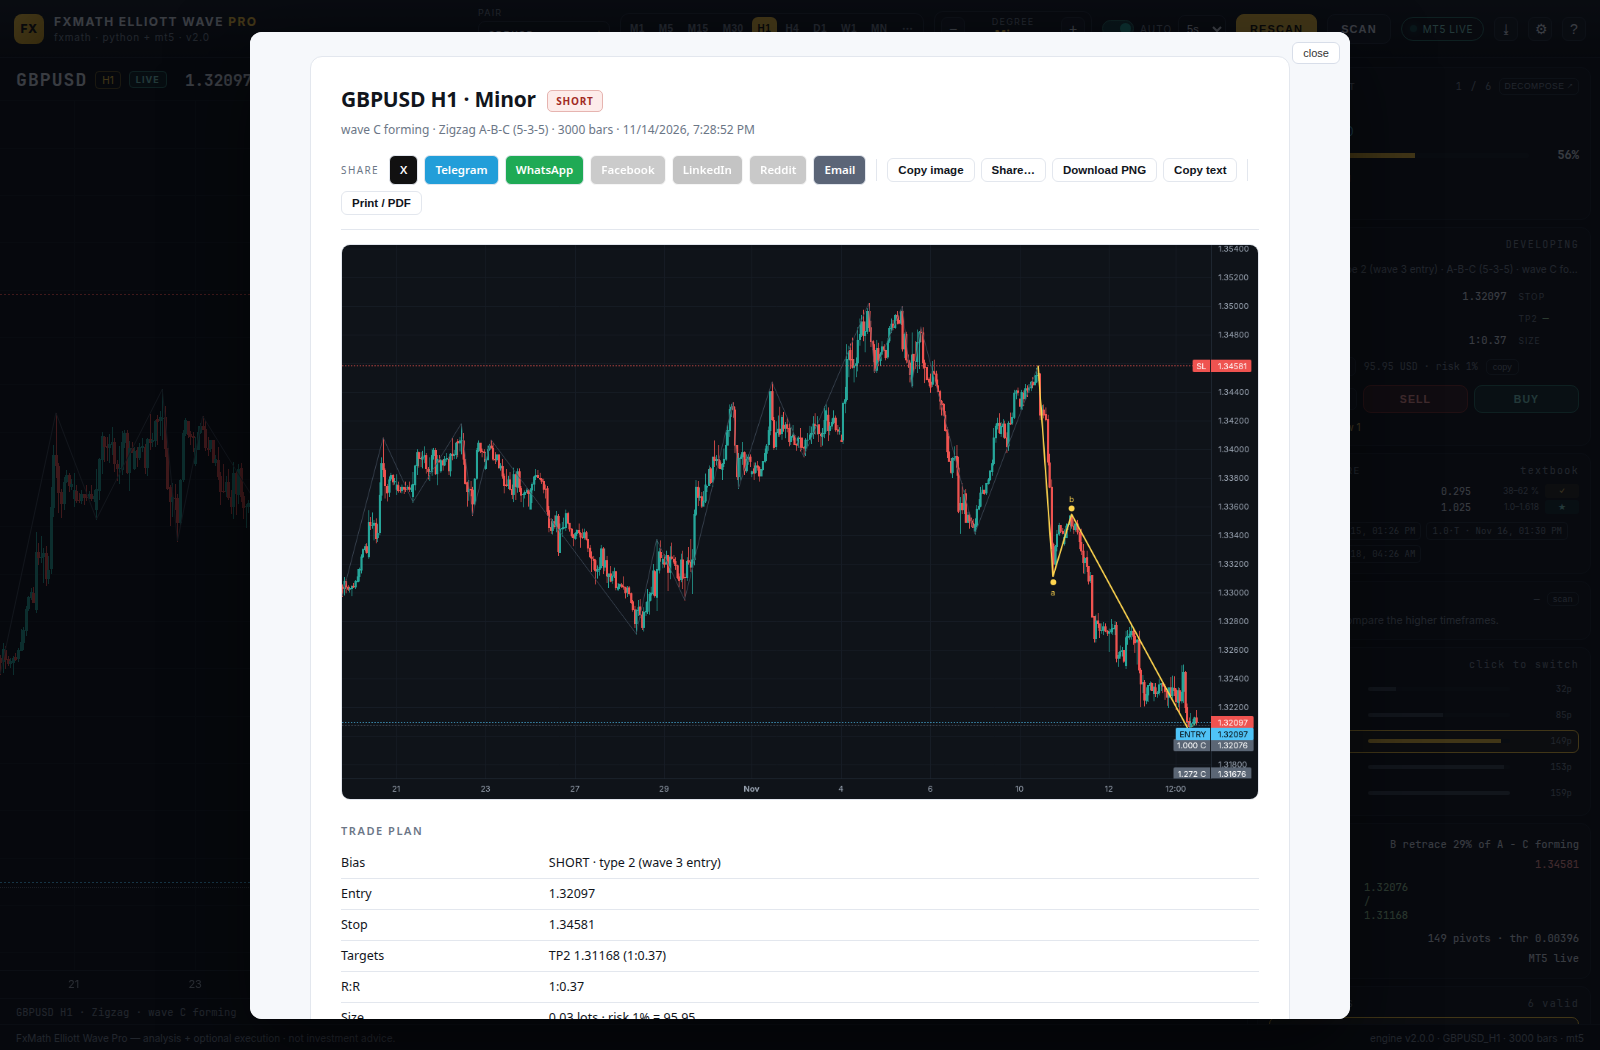
Add ?report=preview to the URL to see the same sheet inside the app instead of a
popup — handy on tablets and for screenshots.
Workspaces
Settings → Workspaces saves the current symbol, timeframe, degree, engine parameters, layers and risk under a name, and restores all of it later.
11Monitoring and alerts
The watcher runs inside the server, so it keeps working after you close the tab.
Settings → MONITOR sets the interval, the symbol list, the timeframe list and an optional webhook. Events fire only when something actually changes:
- a new count appears (pattern, start or leg count changed),
- the bias flips,
- the count is invalidated,
- the plan changes (entry, stop or targets moved).
They land in alerts.json, appear in the ALERTS card (polled every 20 s) and, if a
webhook is set, are POSTed as {"text": "…"} — which Slack, Discord, Mattermost and n8n
all accept.
{
  "monitor": {
    "enabled": true,
    "interval": 60,
    "symbols": ["EURUSD", "GBPUSD", "XAUUSD", "USDJPY"],
    "tfs": ["H1", "H4", "D1"],
    "degree": 2
  },
  "webhook": "https://hooks.slack.com/services/..."
}
The same file lives in ~/.fxmath-ewp/config.json. Disable the watcher with
wine python -m ewp --no-monitor.
12Trading from the chart
Optional, off by default, and locked on live accounts until you unlock it.
Enabling
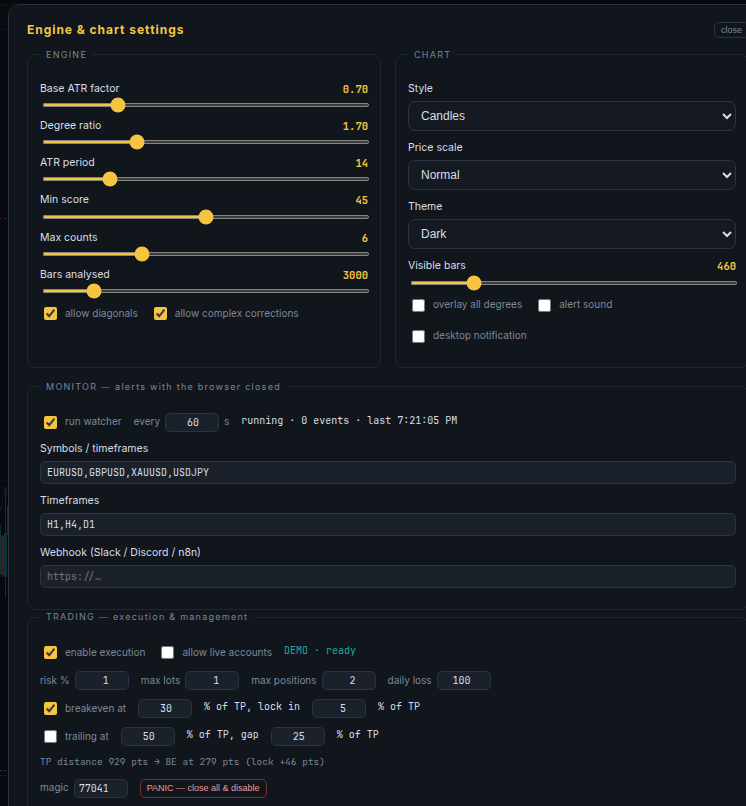
| Setting | Default | Effect |
|---|---|---|
| enable execution | off | master switch — nothing can be sent while off |
| allow live accounts | off | second lock; a live account stays blocked until ticked |
| risk % | 1 | risk budget used for the plan's lot size |
| max lots | 1.0 | absolute volume cap |
| max positions | 2 | simultaneous positions opened by this app |
| daily loss | 100 | after this realised loss, new entries are blocked for the day |
| breakeven | 30 % / 5 % of TP | once price covers 30 % of the distance to TP, move the stop to entry + 5 % of that distance |
| trailing | off · 50 % / 25 % of TP | once price covers 50 % of the way to TP, keep the stop 25 % of the TP distance behind price |
| magic | 770413 | identifies this app's positions |
| PANIC | — | disables trading and closes everything it opened |
Placing an order
- Set
LOTS(pre-filled from the plan's risk sizing). - Press BUY or SELL.
- Check the confirmation: account mode, symbol, side, volume, market entry, SL, TP and the approximate money at risk. If the count disagrees with your click, it warns you.
- SEND ORDER.
The stop and target come from the plan, so the order is a bracket from the start.
Managing positions
The POSITIONS card appears while something is open: side, volume, entry, live P/L and a
× per position, plus close all and today's realised P/L. Breakeven and
trailing are applied by a manager thread every few seconds.
Breakeven and trailing are percentages of the take profit
Both rules are expressed relative to the distance between entry and TP, so one setting works on every instrument — a point means something different on EURUSD, gold and an index, a percentage of TP does not.
| Trigger | Action | |
|---|---|---|
| Breakeven | price covers trigger_pct % of the way to TP (default 30 %) | stop moves to entry + offset_pct % of the TP distance (default 5 %) |
| Trailing | price covers trigger_pct % of the way to TP (default 50 %) | stop stays trail_pct % of the TP distance behind price (default 25 %) |
Example — long from 1.1000 with TP at 1.1100 (1 000 points):
- at 1.1030 (30 %) the stop moves to 1.1005 (+5 %);
- at 1.1050 (50 %) the stop trails at 1.1025 (25 % behind);
- at 1.1080 it is at 1.1055 — the stop only ever tightens, never loosens.
The settings card prints the equivalent in points for the chart you are looking at, so you always know what “30 %” currently means in money.
What the app does for you
| Filling modes | Negotiates FOK / IOC from the symbol's filling_mode; a rejection retries the next allowed mode. |
| Volumes | Rounded to volume_step, clamped to min/max and to your max-lots cap. |
| Stops | Refused if closer than the broker's trade_stops_level, with a readable message. |
| Margin | Checked with order_calc_margin before sending. |
| AutoTrading | Detected — if the terminal's AutoTrading button is off, it says so instead of returning a broker code. |
| Audit | Every attempt, fill and rejection is appended to orders.jsonl. |
Common broker replies
| Message | Meaning |
|---|---|
10018 Market closed | Weekend or holiday — nothing was sent. |
10027 AutoTrading disabled | Click the AutoTrading button in the terminal. |
10030 Unsupported filling mode | The symbol rejects every mode the app tried. |
10016 Invalid stops | SL/TP too close to price for this broker. |
10019 No money | Not enough free margin for that volume. |
13Settings reference
Every switch in one table, with the effect of moving it.
Engine
| Setting | Range | Effect |
|---|---|---|
| Base ATR factor | 0.15–4 | swing threshold of the finest degree = ATR × base. Lower = more pivots. |
| Degree ratio | 1.1–4 | each coarser degree multiplies the threshold. Higher = degrees further apart. |
| ATR period | 3–200 | true-range window |
| Min score | 0–95 | counts below this are dropped |
| Max counts | 1–24 | alternatives kept per degree |
| Bars analysed | 200–20 000 | history window (same as the BARS field) |
| allow diagonals | on/off | accept overlapping wave 4 structures |
| complex corrections | on/off | accept WXY / WXYXZ / diametric combinations |
Chart
| Style | candles or line |
| Price scale | normal or logarithmic |
| Theme | dark or light |
| Visible bars | viewport zoom only — does not change the analysis |
| overlay all degrees / alert sound / desktop notification | layer, audio and browser notification toggles |
Layers
Structure · wave labels · Fibonacci · targets · count channel · history · sub-waves · all degrees · Fib grid · HTF ghost. The all button in the card header toggles the set.
14Keyboard and mouse
Chart
| 1–5 | degree |
| R | rescan (drop caches) |
| A | auto-refresh on/off |
| X | decompose one degree finer |
| B | backtest |
| P | export report |
| S | scanner |
Layers & drawing
| F / H / L | fib · history · labels |
| D | all degrees |
| T / C / B | trendline · channel · fib |
| M / G | label · auto channel |
| Del / ⇧Del | delete selected · clear all |
| ? / Esc | help · close |
| , | settings |
Mouse
| Right-click chart | the action menu: decompose, draw, layers, backtest, report |
| Click a drawing | select it (turns red) |
| Drag / wheel | pan and zoom, as usual |
| Click an alternative | make that count active |
| Click a degree row | switch degree |
15Troubleshooting
| Symptom | Cause and fix |
|---|---|
Pill says MT5 OFFLINE | The terminal is closed or logged out. Start it; the app reconnects on the next refresh. |
Pill says CSV DATA | MetaTrader5 is not importable in the Python that runs the app — use wine python -m ewp. |
| symbol not offered by this broker | Type a few letters in PAIR to see the real names; brokers decorate symbols (.m, _i) and the app resolves the common ones. |
| Chart empty for a new pair | The terminal builds history on the first request; press RESCAN once. |
| No valid count | Lower min score, switch degree, or wait for a cleaner structure. |
| Port already in use | The launcher picks the next free port itself, or use PORT=8080 ./run.sh. |
| Blank page in the browser | static/ is missing (packaged build) — rebuild with the assets. |
10018 Market closed | Weekend or holiday; nothing was sent. |
AutoTrading is off | Click the AutoTrading button in the terminal toolbar. |
| live trading is locked | Tick allow live accounts in Settings → TRADING. |
| daily loss limit hit | The cap blocks new entries until the next day; raise it deliberately if you want. |
| Stop moved on its own | Breakeven or trailing is enabled — that is the manager thread. |
| Scan very slow the first time | Building history for that symbol/depth; later scans are much faster. |
16FAQ
Does it need an EA or indicator installed in MT5?
No. The Python bridge talks to the terminal over IPC. You need the terminal running and logged in, nothing compiled or attached.
Is it repainting?
Confirmed pivots never move: a swing is only registered after price reverses by the degree threshold, and it is placed on the bar of the actual extreme. The last pivot is explicitly marked provisional — that is the wave forming now, and it should change.
Why does the plan sometimes say WAIT?
Because the impulse is complete. The next move is the correction, and joining an exhausted trend is the most common Elliott mistake. Decompose into the ABC instead.
Can two counts both be valid?
Yes — that is the nature of the method. Alternatives are ranked and you choose; the app never pretends there is a single truth.
Does the backtest include spread and commission?
No. It measures the structural edge (R multiples on the plan's levels). Treat it as a filter, not as a P&L statement.
Can I trade a live account?
Yes, after ticking allow live accounts. Caps, the daily loss limit and the panic button still apply, and every order is audited.
Where is my data?
Nothing leaves your machine. Settings, journal, alerts and the order log live in
~/.fxmath-ewp/; drawings live in the browser's local storage.
Can it run on another platform (cTrader, NinjaTrader, IB)?
Not yet. The engine is platform-neutral; each platform needs a data adapter and, for trading, a broker adapter. MT5 is the connector that ships today.
17Glossary
| Term | Meaning in this app |
|---|---|
| Degree | How large the waves are. Five levels, Primary to Minuette. |
| Pivot / swing | A confirmed turning point in the ZigZag. |
| Provisional pivot | The running extreme after the last confirmed pivot — the wave forming now. |
| Invalidation | The price that voids the count; it becomes the stop. |
| Score | 0–100 confidence used to rank competing counts. |
| Alternative | A different rule-compliant reading of the same pivots. |
| Thrust | The projected Fibonacci end of an incomplete wave (TP1/TP2). |
| Truncated fifth | Wave 5 fails to exceed wave 3 — a failure signal. |
| Running flat / running triangle | Corrections whose B leg exceeds the start of the pattern: trend strength. |
| Diametric | A seven-legged diamond that contracts then expands, symmetric in time. |
| WXY / WXYXZ | Combinations of corrections joined by connector waves X. |
| Type 1 / 2 / 3 | Advanced GET setup names: failure, wave-3 entry, late entry. |
| R multiple | Profit or loss expressed as a multiple of the risk taken. |
| HTF | Higher timeframe — the next degree up from the chart you are on. |
| Magic number | An ID attached to orders so the app recognises its own positions. |